Analyticity#
Show code cell content
import os
import warnings

import matplotlib.pyplot as plt
import numpy as np
import sympy as sp
from ampform.dynamics import PhaseSpaceFactor, relativistic_breit_wigner_with_ff
from IPython.display import Math, display
from ipywidgets import widgets
from matplotlib import cm
from mpl_interactions import heatmap_slicer

warnings.filterwarnings("ignore")

plt.rcParams.update({"font.size": 14})

STATIC_WEB_PAGE = {"EXECUTE_NB", "READTHEDOCS"}.intersection(os.environ)
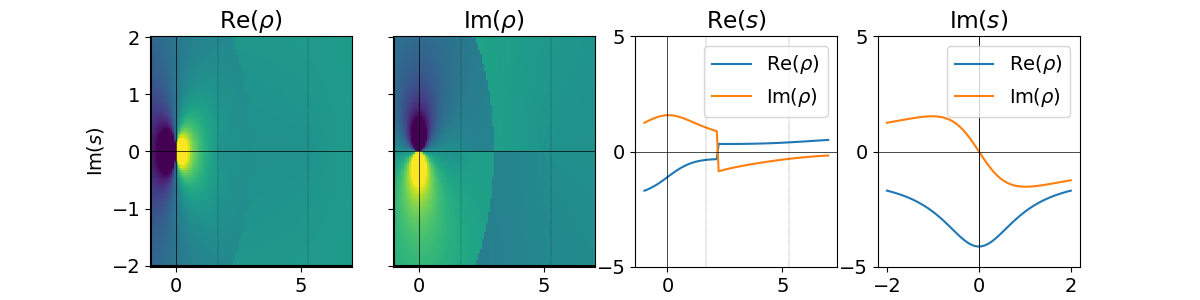
Branch points of \(\rho(s)\)#
Investigation of Section 2.1.2 in [Aitchison, 2015].
Show code cell source
s = sp.Symbol("s")
m1, m2 = sp.symbols("m1 m2", real=True)
rho = 16 * sp.pi * PhaseSpaceFactor(s, m1, m2).doit()
rho
\[\displaystyle \frac{\sqrt{\frac{\left(s - \left(m_{1} - m_{2}\right)^{2}\right) \left(s - \left(m_{1} + m_{2}\right)^{2}\right)}{s}}}{\sqrt{s}}\]
Or, assuming both decay products to be of unit mass:
Show code cell source
rho.subs({
    m1: 1,
    m2: 1,
})
\[\displaystyle \frac{\sqrt{s - 4}}{\sqrt{s}}\]
Show code cell content
np_rho = sp.lambdify((s, m1, m2), rho, "numpy")

m1_val = 1.8
m2_val = 0.5
s_thr = (m1_val + m2_val) ** 2
s_diff = abs(m1_val - m2_val) ** 2

x = np.linspace(-1, +7, num=100)
y = np.linspace(-2, +2, num=100)
X, Y = np.meshgrid(x, y)
s_values = X + Y * 1j
rho_values = np_rho(s_values, m1=m1_val, m2=m2_val)

<Figure size 640x480 with 0 Axes>
Show code cell source
fig, axes = heatmap_slicer(
    x,
    y,
    (rho_values.real, rho_values.imag),
    heatmap_names=(R"Re($\rho$)", R"Im($\rho$)"),
    labels=("Re($s$)", "Im($s$)"),
    interaction_type="move",
    slices="both",
    vmin=-5,
    vmax=5,
    figsize=(12, 3),
)
for ax in axes[2:]:
    ax.set_ylim(rho_min, rho_max)
    tick_width = 5
    tick_min = np.around(rho_min / tick_width, decimals=0) * tick_width
    ax.set_yticks(np.arange(tick_min, rho_max + 0.1, 5))
axes[2].set_title("Re($s$)")
axes[3].set_title("Im($s$)")
for ax in axes[:3]:
    ax.axvline(s_diff, c="black", linewidth=0.3, linestyle="dotted")
    ax.axvline(s_thr, c="black", linewidth=0.3, linestyle="dotted")
for ax in axes:
    ax.axvline(0, c="black", linewidth=0.5)
    ax.axhline(0, c="black", linewidth=0.5)
axes[3].axvline(0, c="black", linewidth=0.5)
plt.show()
Physical vs. unphysical sheet#
Interactive reproduction of Figure 49.1 on PDG2020, §Resonances, p.2. The formulas below come from a relativistic_breit_wigner_with_ff() with \(L=0\). As phase space factor, we used the square root of BreakupMomentumSquared instead of the default PhaseSpaceFactor, because this introduces only one branch point in the \(s\)-plane (namely the one over the nominator).
Show code cell source
from ampform.dynamics import BreakupMomentumSquared


def breakup_momentum(s: sp.Symbol, m_a: sp.Symbol, m_b: sp.Symbol) -> sp.Expr:
    return sp.sqrt(BreakupMomentumSquared(s, m_a, m_b).doit())


s = sp.Symbol("s")
m0, gamma0, m1, m2 = sp.symbols("m0 Gamma0 m1 m2", real=True, positive=True)

unphysical_amp = relativistic_breit_wigner_with_ff(
    s,
    m0,
    gamma0,
    m_a=m1,
    m_b=m2,
    angular_momentum=0,
    meson_radius=1,
    phsp_factor=breakup_momentum,
).doit()

sqrt_term = unphysical_amp.args[2].args[0].args[2]
physical_amp = unphysical_amp.subs(sqrt_term, sp.sqrt(sqrt_term**2))

display(
    Math(R"\mathrm{Physical:} \quad " + sp.latex(physical_amp)),
    Math(R"\mathrm{Unphysical:} \quad " + sp.latex(unphysical_amp)),
)
\[\displaystyle \mathrm{Physical:} \quad \frac{\Gamma_{0} m_{0}}{\Gamma_{0} m_{0}^{2} \sqrt{- \frac{\left(s - \left(m_{1} - m_{2}\right)^{2}\right) \left(s - \left(m_{1} + m_{2}\right)^{2}\right)}{s \left(m_{0}^{2} - \left(m_{1} - m_{2}\right)^{2}\right) \left(m_{0}^{2} - \left(m_{1} + m_{2}\right)^{2}\right)}} + m_{0}^{2} - s}\]
\[\displaystyle \mathrm{Unphysical:} \quad \frac{\Gamma_{0} m_{0}}{- \frac{i \Gamma_{0} m_{0}^{2} \sqrt{\frac{\left(s - \left(m_{1} - m_{2}\right)^{2}\right) \left(s - \left(m_{1} + m_{2}\right)^{2}\right)}{s}}}{\sqrt{\left(m_{0}^{2} - \left(m_{1} - m_{2}\right)^{2}\right) \left(m_{0}^{2} - \left(m_{1} + m_{2}\right)^{2}\right)}} + m_{0}^{2} - s}\]
Show code cell source
args = (s, m0, gamma0, m1, m2)
np_amp_physical = sp.lambdify(args, physical_amp, "numpy")
np_amp_unphysical = sp.lambdify(args, unphysical_amp, "numpy")

x_min, x_max = -0.2, 1.3
y_min, y_max = -1.8, +1.8
z_min, z_max = -2.5, +2.5

x = np.linspace(x_min, x_max, num=50)
y_neg = np.linspace(y_min, -1e-4, num=30)
y_pos = np.linspace(1e-4, y_max, num=30)

X, Y_neg = np.meshgrid(x, y_neg)
X, Y_pos = np.meshgrid(x, y_pos)
s_values_neg = X + Y_neg * 1j
s_values_pos = X + Y_pos * 1j

z_cut_min = 0.75 * z_min
z_cut_max = 0.75 * z_max
cut_off_min = np.vectorize(lambda z: z if z > z_cut_min else z_cut_min)
cut_off_max = np.vectorize(lambda z: z if z < z_cut_max else z_cut_max)

plot_style = {
    "linewidth": 0,
    "alpha": 0.7,
    "antialiased": True,
    "rstride": 1,
    "cstride": 1,
}
axis_style = {
    "c": "black",
    "linewidth": 0.7,
    "linestyle": "dashed",
}

fig, axes = plt.subplots(
    ncols=2,
    figsize=(10, 6),
    subplot_kw={"projection": "3d"},
    tight_layout=True,
)
ax1, ax2 = axes
fig.suptitle("$S$-wave Breit-Wigner ($L=0$) plotted over the complex $s$-plane")

m0_min = np.sign(x_min) * np.sqrt(np.abs(x_min))
m0_max = np.sign(x_max) * np.sqrt(np.abs(x_max))

sliders = {
    "m0": widgets.FloatSlider(
        min=m0_min,
        max=m0_max,
        value=0.8,
        step=0.01,
        description="$m_0$",
    ),
    "gamma0": widgets.FloatSlider(
        min=0.0,
        max=y_max,
        value=0.3,
        step=0.01,
        description=R"$\Gamma_0$",
    ),
    "m1": widgets.FloatSlider(
        min=1e-4,
        max=m0_max / 2,
        step=0.01,
        description="$m_1$",
    ),
    "m2": widgets.FloatSlider(
        min=1e-4,
        max=m0_max / 2,
        step=0.01,
        description="$m_2$",
    ),
}


@widgets.interact(**sliders)
def plot(m0, gamma0, m1, m2):
    def plot_expression(ax, amp, neg_color="green"):
        ax.clear()
        z_values_neg = amp(s_values_neg, m0, gamma0, m1, m2).imag
        z_values_pos = amp(s_values_pos, m0, gamma0, m1, m2).imag
        Z_neg = cut_off_min(cut_off_max(z_values_neg))
        Z_pos = cut_off_min(cut_off_max(z_values_pos))

        s_thr = (m1 + m2) ** 2
        x0 = x[x >= s_thr] + 1e-4j
        y0 = np.zeros(len(x0))
        z0 = amp(x0, m0, gamma0, m1, m2).imag

        ax.plot_surface(X, Y_neg, Z_neg, **plot_style, color=neg_color)
        ax.plot_surface(X, Y_pos, Z_pos, **plot_style, color="green")
        ax.plot(x0, y0, z0, linewidth=2.5, c="darkred", zorder=8)
        ax.scatter([x0[0]], [0], [z0[0]], c="darkred", s=20, zorder=9)

        ax.set_xlabel("Re($s$)", labelpad=-15)
        ax.set_ylabel("Im($s$)", labelpad=-15)
        ax.set_zlabel("Im($A$)", labelpad=-15)
        ax.set_xticks([])
        ax.set_yticks([])
        ax.set_zticks([])
        ax.set_zlim(z_min, z_max)

    plot_expression(ax1, np_amp_physical)
    plot_expression(ax2, np_amp_unphysical, neg_color="gold")

    ax1.text(x_min, y_max, z_max / 2, "physical sheet", c="green")
    ax2.text(x_min, y_min, -z_max, "unphysical sheet", c="gold")

    fig.canvas.draw_idle()
