





Lecture 11 – Helicity formalism#
Lecture 11 by Vincent Mathieu introduces spin into the Lorentz kinematics of Lecture 2 – Kinematics and treats it with the helicity formalism. The lecture comes with a data sample, Three-particles-3.dat, in which the spin of the resonances plays a role. In this notebook, we analyse this sample visually with a Dalitz plot and compare it with Three-particles-1.dat from Lecture 2 – Kinematics. We do not formulate an amplitude model for these data here.
Reaction#
As in Lecture 2 – Kinematics, each event in the data sample consists of the four-momenta \((E, p_x, p_y, p_z)\) of the beam particle \(a\) and the three final-state particles in the CoM frame. The four-momentum of the target \(b\) follows from four-momentum conservation.
def load_momenta(url: str, md5: str) -> tuple[np.ndarray, ...]:
    filename = gdown.cached_download(
        url=url,
        path=f"data/{url.rsplit('/', maxsplit=1)[-1]}",
        hash=f"md5:{md5}",
        quiet=True,
        verify=False,
    )
    data = np.loadtxt(filename)
    pa, p1, p2, p3 = (data[i::4].T for i in range(4))
    pb = p1 + p2 + p3 - pa
    return pa, pb, p1, p2, p3


pa, pb, p1, p2, p3 = load_momenta(
    url="https://indico.ific.uv.es/event/6803/contributions/21223/attachments/11221/15563/Three-particles-3.dat",
    md5="75fedf381f9b62d3210ff200fc63165f",
)
p0 = p1 + p2 + p3
The masses of the particles identify the reaction. Here, \(m_0\) is the invariant mass of the final state, that is, the CoM energy \(\sqrt{s}\).
def mass(p: np.ndarray) -> np.ndarray:
    return np.sqrt(mass_squared(p))


def mass_squared(p: np.ndarray) -> np.ndarray:
    return p[0] ** 2 - np.sum(p[1:] ** 2, axis=0)
We look up particles with these masses using the particle package. The gluon is excluded, because it is massless like the photon.
So this is the same reaction as in Three-particles-1.dat: a photon \(\gamma\) hitting a proton \(p\), producing an \(\eta\) meson, a pion \(\pi^0\), and a proton \(p\), at the same CoM energy of \(\sqrt{s} \approx 4.1\text{ GeV}\). The two samples can therefore be compared directly.
Dalitz plot#
We plot two of the invariant masses squared \(s_{ij} = (p_i + p_j)^2\) against each other and estimate the positions \(R_{ij}\) of the resonance bands from the peaks in the distributions of \(s_{12}\), \(s_{23}\), and \(s_{31}\).
s = {
    "12": mass_squared(p1 + p2),
    "23": mass_squared(p2 + p3),
    "31": mass_squared(p3 + p1),
}
peaks = {ij: find_peak(s_ij) for ij, s_ij in s.items()}
{ij: round(float(np.sqrt(r)), 3) for ij, r in peaks.items()}
{'12': 1.317, '23': 1.237, '31': 1.564}
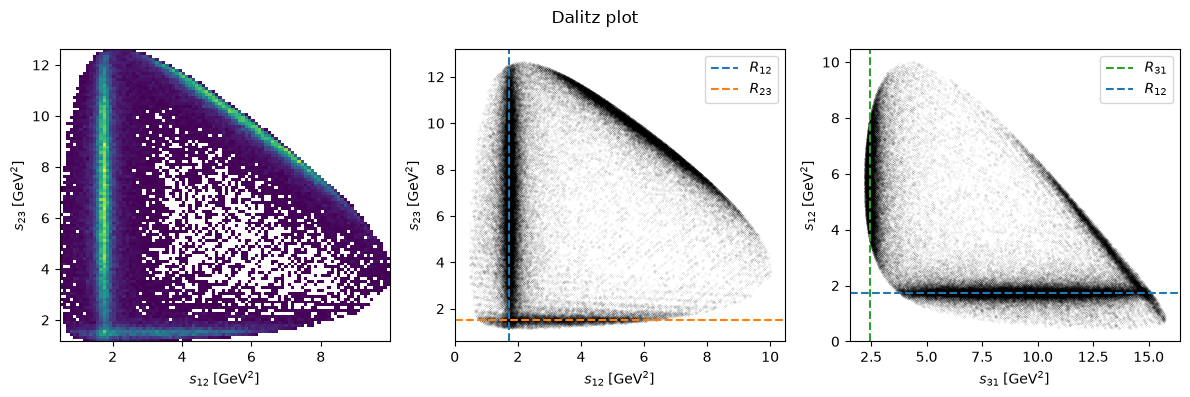
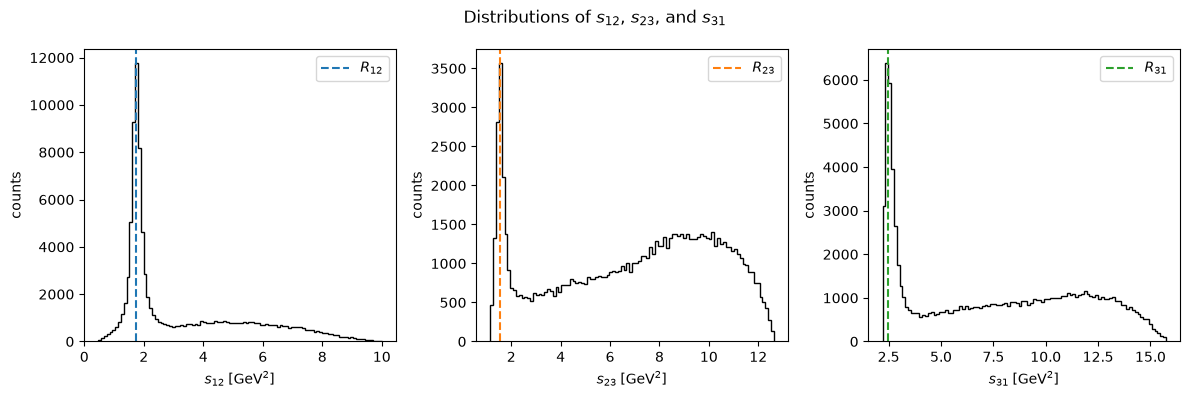
The candidates for the resonances \(R_{12} \to \eta\pi^0\), \(R_{23} \to \pi^0 p\), and \(R_{31} \to p\eta\) are:
find_candidates(np.sqrt(peaks["12"]), delta_in_gev=0.01, charge=0)
[<Particle: name="a(2)(1320)0", pdgid=115, mass=1318.2 ± 0.6 MeV>,
 <Particle: name="Xi0", pdgid=3322, mass=1314.86 ± 0.20 MeV>,
 <Particle: name="Xi~0", pdgid=-3322, mass=1314.86 ± 0.20 MeV>]
find_candidates(np.sqrt(peaks["23"]), delta_in_gev=0.01, charge=+1)
[<Particle: name="Delta(1232)~+", pdgid=-1114, mass=1232.0 ± 2.0 MeV>,
 <Particle: name="Delta(1232)+", pdgid=2214, mass=1232.0 ± 2.0 MeV>,
 <Particle: name="b(1)(1235)+", pdgid=10213, mass=1230 ± 3 MeV>,
 <Particle: name="a(1)(1260)+", pdgid=20213, mass=1230 ± 40 MeV>]
[
    p
    for p in find_candidates(np.sqrt(peaks["31"]), delta_in_gev=0.05, charge=+1)
    if p.pdgid > 0 and np.isclose(p.I, 1 / 2)
]
[<Particle: name="N(1520)+", pdgid=2124, mass=1515 ± 5 MeV>,
 <Particle: name="N(1535)+", pdgid=22212, mass=1530 ± 15 MeV>]
Following the same reasoning as in Lecture 2 – Kinematics, these are the same resonances as in Three-particles-1.dat: \(a_2(1320) \to \eta\pi^0\), \(\Delta(1232)^+ \to \pi^0 p\), and \(N(1535)^+ \to p\eta\). The bands in this Dalitz plot are more pronounced, however, and the events are distributed differently along them.
Spin effects#
A resonance with nonzero spin generally produces an angular distribution of its decay products in its rest frame. Along a resonance band in the Dalitz plot, the other invariant masses are linear functions of the cosine of this decay angle, so an angular distribution shows up as a modulation of the event density along the band.
Three-particles-1.dat describes the same reaction at the same energy, but Lecture 2 – Kinematics shows that its event density along the bands is roughly flat. We therefore compare the normalised event density along each band in the two samples.
_, _, q1, q2, q3 = load_momenta(
    url="https://indico.ific.uv.es/event/6803/contributions/21220/attachments/11209/15504/Three-particles-1.dat",
    md5="a49ebfd97ae6a02023291df665ab924c",
)
s_ref = {
    "12": mass_squared(q1 + q2),
    "23": mass_squared(q2 + q3),
    "31": mass_squared(q3 + q1),
}
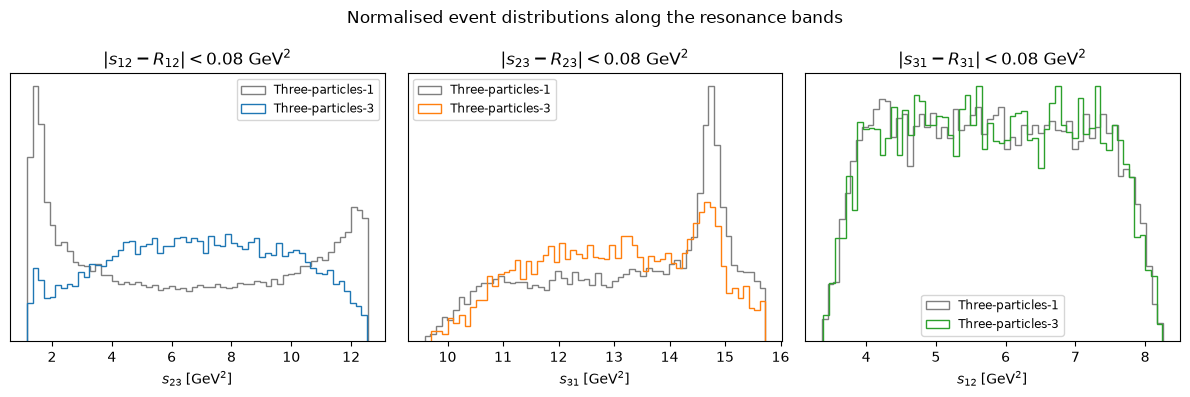
The difference is clearest along the \(a_2(1320)\) band. In Three-particles-1.dat, the event density is flat except at the ends of the band, where it crosses the \(\Delta(1232)\) and \(N(1535)\) bands. In Three-particles-3.dat, the density is largest in the middle of the band and drops towards its ends, which correspond to forward and backward decay angles. Such a modulation is what we expect from the decay of a resonance with nonzero spin, like the \(a_2(1320)\), which has \(J=2\). The \(\Delta(1232)\) band shows a weaker modulation of the same kind. The \(N(1535)\) band looks the same in both samples, which is consistent with its spin \(J=1/2\): the decay of an unpolarized spin-1/2 resonance into \(p\eta\) is isotropic.
To determine the spins and helicity couplings quantitatively, one would fit an amplitude model in the helicity formalism to these data.