Rotating square root cuts#
See also
Lecture 17 on collision theory of the STRONG2020 HaSP School by Miguel Albaladejo.
There are multiple solutions for \(x\) to the equation \(y^2 = x\). The fact that we usually take \(y = \sqrt{x}\) with \(\sqrt{-1} = i\) to be ‘the’ solution to this equation is just a matter of convention. It would be more complete to represent the solution as a set of points in the complex plane, that is, the set \(S = \left\{\left(z, w\right)\in\mathbb{C}^2 | w^2=z\right\}\). This is set forms a Riemann surface in \(\mathbb{C}^2\) space.
In the figure below we see the Riemann surface of a square root in \(\mathbb{C}^2\) space. The \(xy\) plane forms the complex domain \(\mathbb{C}\), the \(z\) axis indicates the imaginary part of the Riemann surface and the color indicates the real part.
From this figure it becomes clear that it is impossible to define one single-valued function that gives the solution to \(w^2 = u\) is \(w \neq 0\). The familiar single-valued square root operation \(\sqrt{}\) covers only one segment, or sheet, of the Riemann surface and it is defined in such a way that \(\sqrt{-1}=i\). The other half of the surface is covered by \(-\sqrt{}\).
Notice, however, that the sheets for the imaginary component of \(\sqrt{}\) are not smoothly connected at each point. The sign flips around \(z\in\mathbb{R^-}\), because we have \(\sqrt{-1+0i}=-1\) and \(\sqrt{-1+0i}=+1\). We call this discontinuity in the Riemann sheet a branch cut.
By definition, the branch cut of \(\sqrt{}\) is located at \(\mathbb{R}^-\). There is no requirement about this definition though: we can segment the Riemann surface in any way into two sheets, as long as the sheets remain single-valued. One option is to rotate the cut. With the following definition, we have a single-value square-root function, where the cut is rotated over an angle \(\phi\) around \(z=0\).
In the following widget, we see what the new rotated square root looks like in the complex plane. The left panes show the imaginary part and the right side shows the real part. The upper figures show the value of the rotated square root on the real axis, \(\mathrm{Re}\,z\).
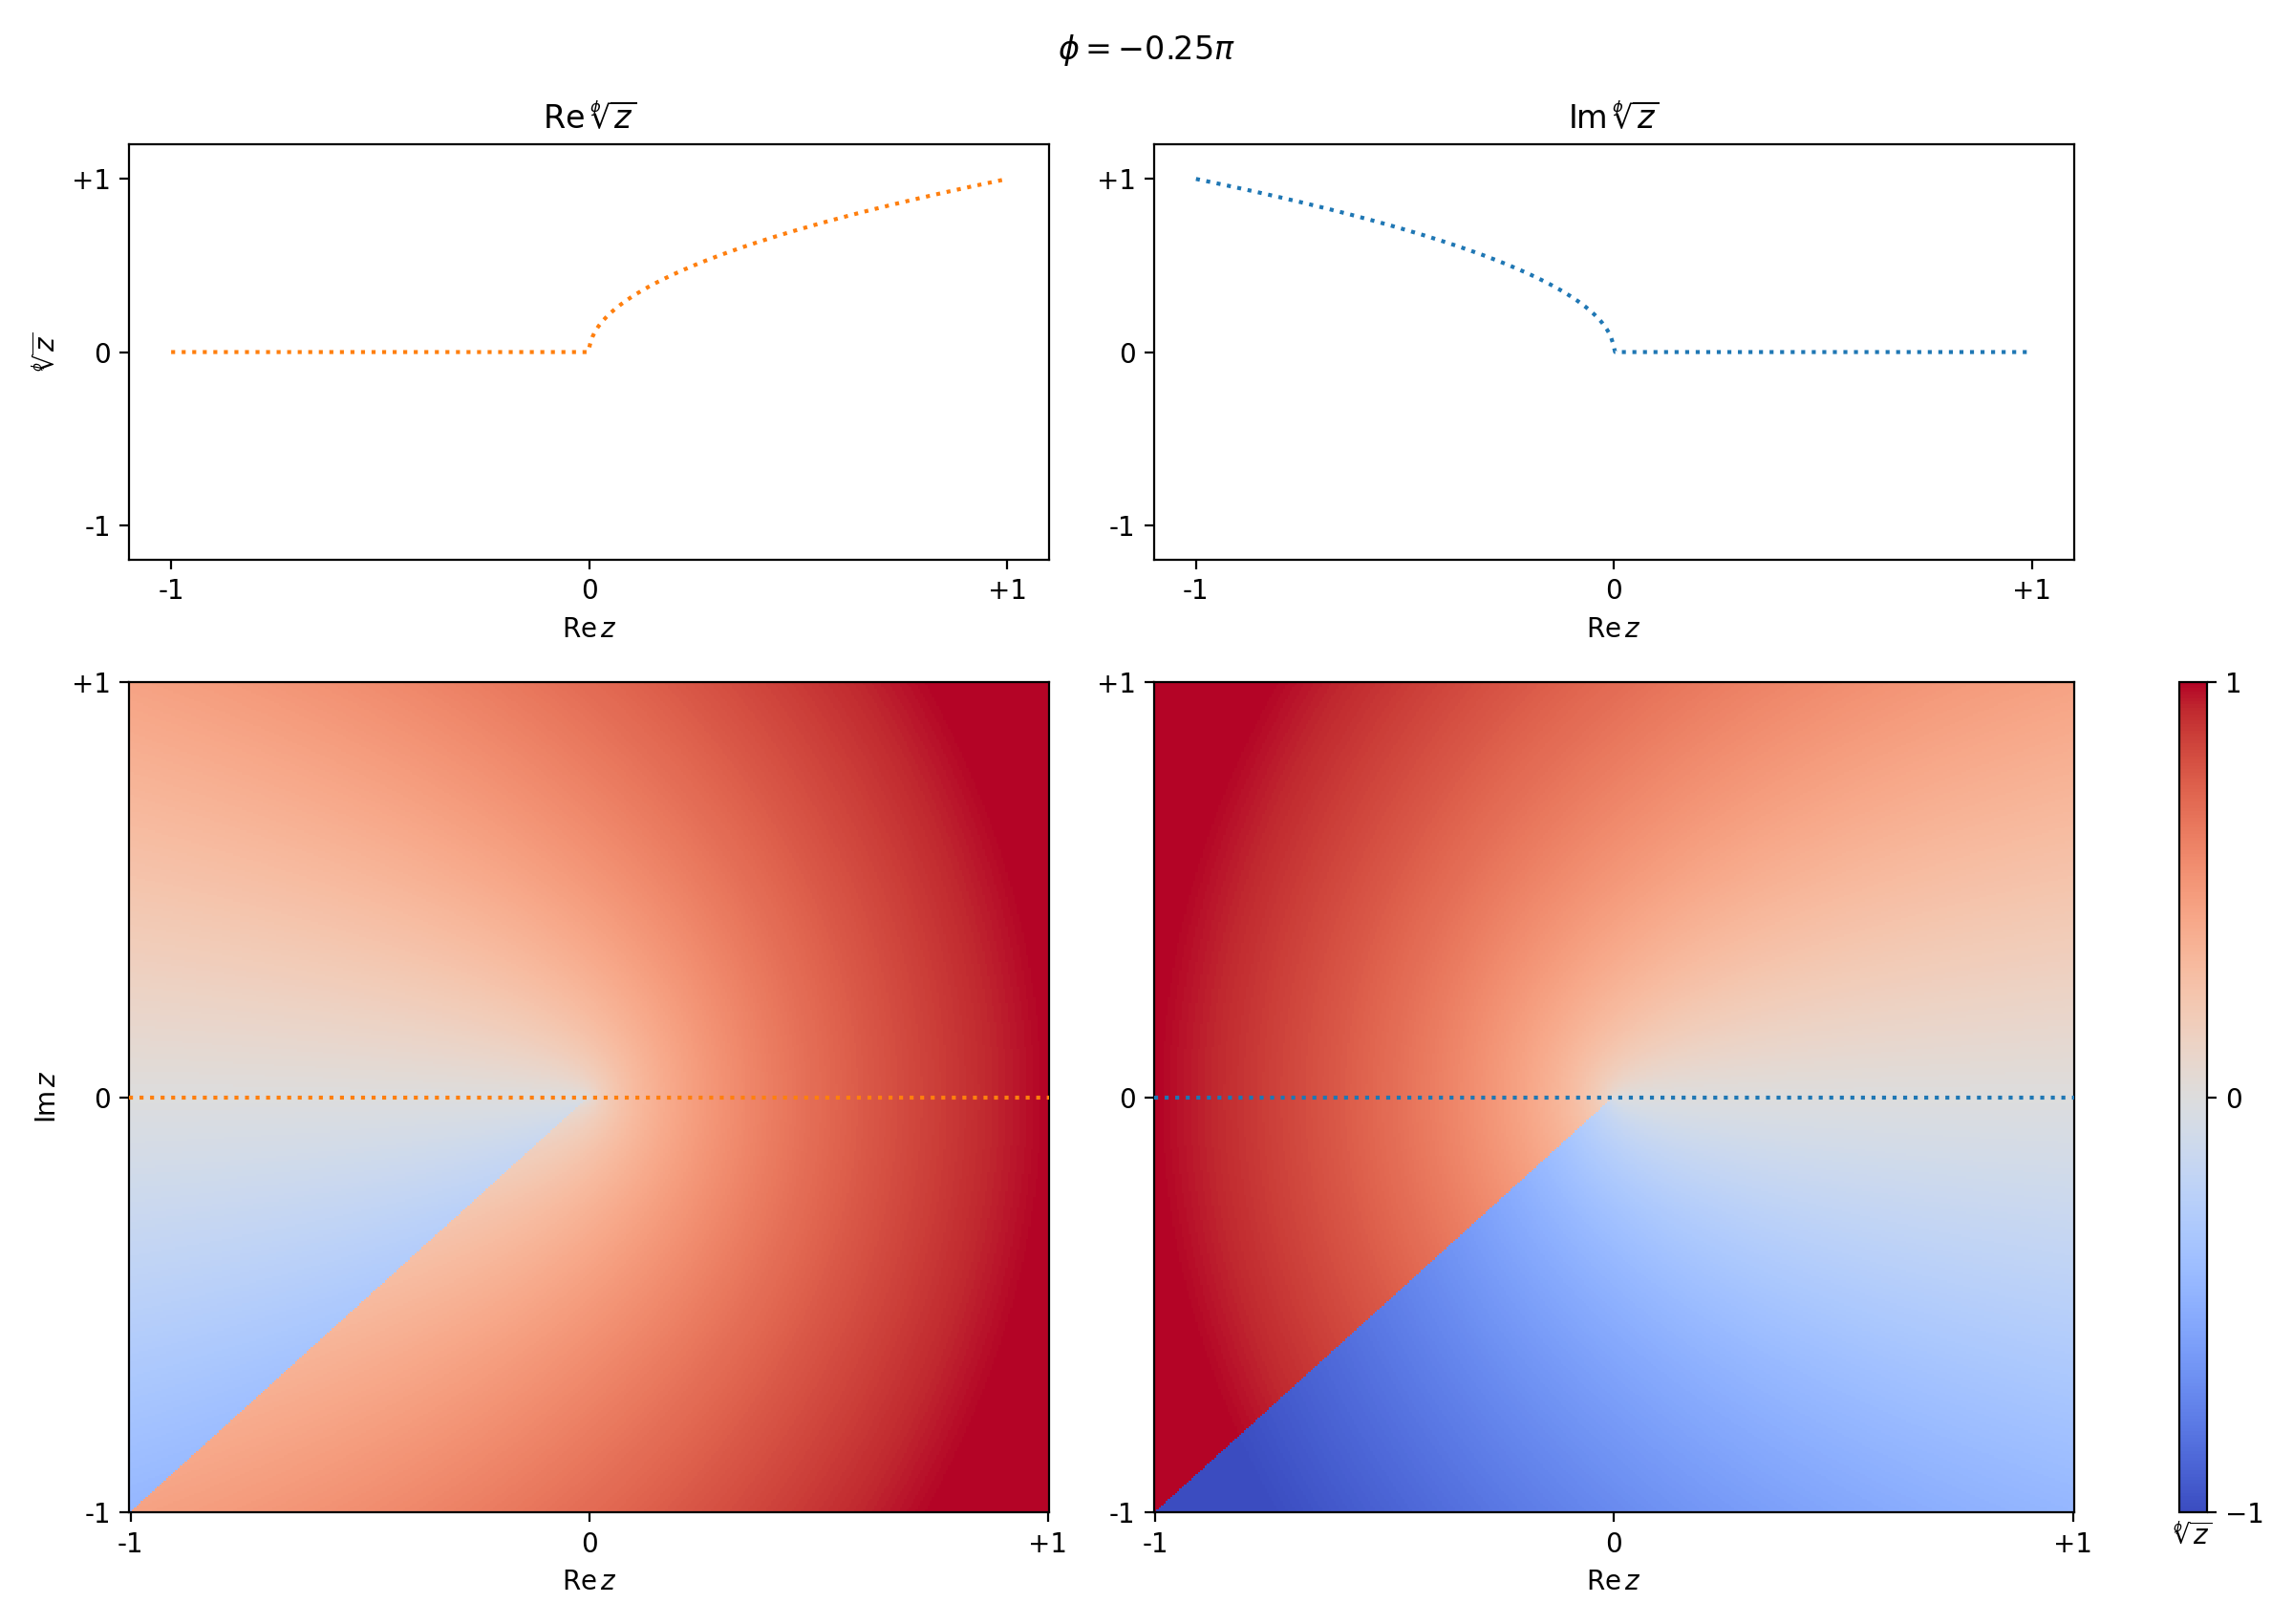
Note
The real part does not have a cut if \(\phi = 2\pi n, n \in \mathbb{Z}\). The cut in the imaginary part disappears if \(\phi = \pi + 2\pi n\).